Barrett, M. 1, Allen, C. 2, Kravitz, A. V. 1, Gaidica, M. 2
1Department of Psychiatry, Washington University in St Louis School of Medicine, St Louis, MO
2The Neurotech Hub, Department of Neuroscience, Washington University in St Louis School of Medicine, St Louis, MO
Problem
Monitoring liquid intake in rodents is a key measure to understanding what interventions might alter consumption—acutely and over longer experimental timeframes [1]. Manual quantification is tedious and delivering liquid via a pump is not truly ad libitum. Ideally, sensing liquid intake could performed using standard vials and even integrated in a manner impervious to the inside of a cage [2]. Here, we present a tube-based magnet float and enclosed magnetic sensor array to determine and record sub-milliliter liquid intake every 10s called “Tubetrode” (Fig 1).

Fig 1. Tubetrode Printed Circuit Board (PCB). The PCB contains eight magnetic sensors (red arrow) and is meant to be enclosed or encapsulated adjacent to a conical liquid delivery tube. R1-R8 are the address select jumpers that can be soldered to address the analog-to-digital converters.
Methods
Circuit Design. Eight ratiometric linear hall effect magnetic sensors (Texas Instruments DRV5053; ±9mT sensitivity) were vertically aligned and integrated with two, 4-channel, 16-bit analog-to-digital converters (ADCs; Texas Instruments ADS1115) to convert magnetic strength into a digital signal [3]. The ADCs are read via I2C bus with four selectable addresses, allowing for two Tubetrode devices to be used together. Power to the board can be gracefully controlled by a load switch (Diodes Incorporated AP22804); see Fig 2.
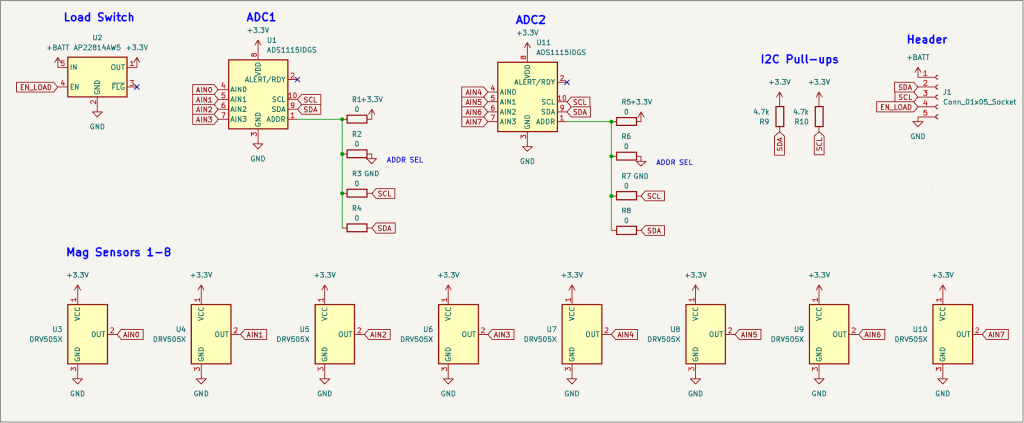
Fig 2. Tubetrode Schematic. Created using KiCad with parts sources from DigiKey.
Magnetic Float. An epoxy-coated magnetic (22mm diameter) was sandwiched between two 3D-printed parts (printed on a FormLabs 3B): the top acting as a waterproof air vessel and the bottom used to guide air bubbles to the sides (Fig 3).

Fig 3. Magnetic Float for Conical Tube. (Left) 3D render of float object with magnet cavity (red arrow). (Middle) Cross section. (Right) 3D printed float with embedded, epoxy-coated magnet next to conical tube.
Software. An Arduino software library was written to:
1.Establish addresses for Tubetrode devices.
2.Read raw sensor values.
3.Estimated milliliters remaining in the tube.
Estimated milliliters were calculated by a manually generated calibration table. Tubetrode for Arduino is available on GitHub: https://github.com/Neurotech-Hub/Tubetrode
Results
Tubetrode was deployed in a mouse cage overnight for testing with data logged to an SD card (Fig 4).

Fig 4. Tubetrode data over 12 hours. (Top) Raw sensor values (S1-S8) measured in volts over time. The magnet float is modulating S3-S5 the most. (Middle) On-board decoding of remaining liquid (mL) based on raw sensor values. (Bottom) The change in liquid level (∆Liquid) over time.
Conclusion
Using a custom circuit design and software library, we were able to design a system “Tubetrode” that could measure liquid at-a-distance with sub-mL resolution.
References
[1] Godynyuk et al., “An Open-Source, Automated Home-Cage Sipper Device for Monitoring Liquid Ingestive Behavior in Rodents.”
[2] García-Diego et al., “Array of Hall Effect Sensors for Linear Positioning of a Magnet Independently of Its Strength Variation. A Case Study.”
[3] Scott Bryson of Texas Instruments, “Application Note: Linear Hall-Effect Sensor Array Design”.
The Neurotech Hub is supported by the McDonnell Center’s for Systems Neuroscience, and Cellular and Molecular Neurobiology.
View the poster PDF.
Sick project!